
Statistiche team Emilia Romagna nelle “2014 SENIOR LEAGUE WORLD SERIES”


![]()
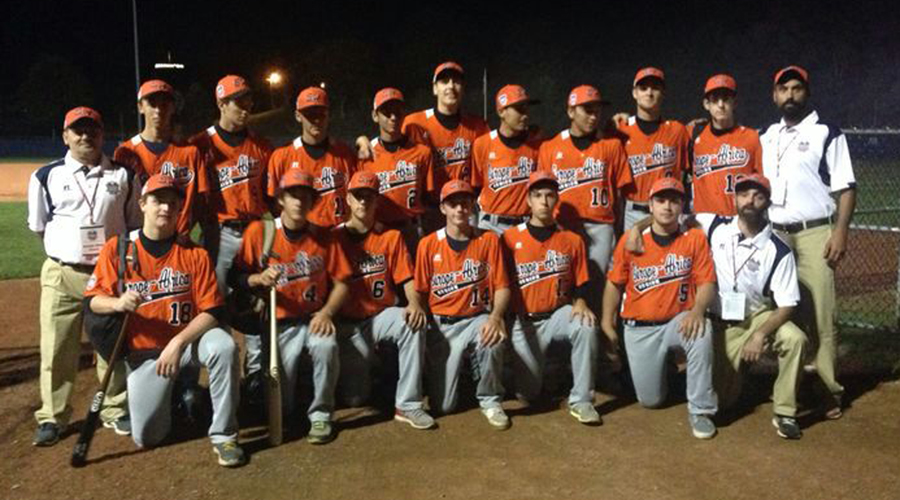
Queste sono le statistiche degli atleti della selezione u17 dell’Emilia Romagna che ha disputato le “2014 SENIOR LEAGUE WORLD SERIES” in rappresentanza della zona EUROPA-AFRICA. Pubblichiamo di seguito dapprima le statitiche di attacco poi quelle di lancio ed infine quelle di difesa. Per ognuna di queste categorie troverete alcune sottocategorie che evidenziano dati statistici veramente molto interessanti che nei campionati Italiani ed Europeei non sono rilevati.
Batting Stats
| # | Roster | GP | PA | AB | H | 1B | 2B | 3B | HR | RBI | R | HBP | ROE | FC | CI | BB | K | AVG | OBP | SLG | OPS |
|---|---|---|---|---|---|---|---|---|---|---|---|---|---|---|---|---|---|---|---|---|---|
| 12 | Matteo Friggeri | 3 | 8 | 5 | 2 | 1 | 1 | 0 | 0 | 2 | 0 | 0 | 0 | 0 | 0 | 3 | 2 | .400 | .625 | .600 | 1.225 |
| 10 | Simone Alfinito Montecchi | 4 | 13 | 11 | 4 | 4 | 0 | 0 | 0 | 2 | 1 | 1 | 0 | 0 | 0 | 1 | 2 | .364 | .462 | .364 | .825 |
| 8 | Davide Azzali | 4 | 13 | 12 | 3 | 3 | 0 | 0 | 0 | 1 | 2 | 0 | 0 | 0 | 0 | 1 | 1 | .250 | .308 | .250 | .558 |
| 13 | Filippo Valenti | 4 | 13 | 12 | 3 | 2 | 1 | 0 | 0 | 0 | 2 | 0 | 0 | 0 | 0 | 1 | 3 | .250 | .308 | .333 | .641 |
| 9 | Carlo Tanara | 3 | 7 | 6 | 1 | 1 | 0 | 0 | 0 | 0 | 0 | 0 | 0 | 0 | 0 | 1 | 3 | .167 | .286 | .167 | .452 |
| 11 | Davide Trolli | 3 | 6 | 6 | 1 | 1 | 0 | 0 | 0 | 0 | 0 | 0 | 1 | 0 | 0 | 0 | 0 | .167 | .167 | .167 | .333 |
| 14 | Marco Corsino | 3 | 7 | 7 | 1 | 1 | 0 | 0 | 0 | 0 | 0 | 0 | 0 | 0 | 0 | 0 | 5 | .143 | .143 | .143 | .286 |
| 7 | Luca Coffrini | 4 | 13 | 9 | 1 | 1 | 0 | 0 | 0 | 1 | 1 | 1 | 1 | 1 | 0 | 2 | 4 | .111 | .308 | .111 | .419 |
| 24 | Edoardo Acerbi | 4 | 10 | 9 | 1 | 1 | 0 | 0 | 0 | 0 | 0 | 0 | 0 | 0 | 0 | 0 | 2 | .111 | .111 | .111 | .222 |
| 4 | Cesare Astorri | 3 | 10 | 9 | 1 | 0 | 1 | 0 | 0 | 2 | 1 | 0 | 0 | 0 | 0 | 1 | 1 | .111 | .200 | .222 | .422 |
| 5 | Giulio Cianci | 4 | 11 | 9 | 1 | 1 | 0 | 0 | 0 | 0 | 0 | 1 | 0 | 1 | 0 | 1 | 0 | .111 | .273 | .111 | .384 |
| 18 | Michele Pomponi | 2 | 3 | 3 | 0 | 0 | 0 | 0 | 0 | 0 | 0 | 0 | 0 | 0 | 0 | 0 | 2 | .000 | .000 | .000 | .000 |
| 2 | Filippo Tomassoni | 1 | 1 | 1 | 0 | 0 | 0 | 0 | 0 | 0 | 0 | 0 | 0 | 0 | 0 | 0 | 0 | .000 | .000 | .000 | .000 |
| 1 | Anthony Falanga | 2 | 4 | 3 | 0 | 0 | 0 | 0 | 0 | 0 | 1 | 0 | 0 | 1 | 0 | 1 | 1 | .000 | .250 | .000 | .250 |
| Totals | 4 | 119 | 102 | 19 | 16 | 3 | 0 | 0 | 8 | 8 | 3 | 2 | 3 | 0 | 12 | 26 | .186 | .288 | .216 | .504 | |
Key
- GP:Games played
- PA:Plate appearances
- AB:At bats
- H:Hits
- 1B:Single
- 2B:Doubles
- 3B:Triples
- HR:Home runs
- RBI:Runs batted in
- R:Runs scored
- HBP:Hit by pitch
- ROE:Reached on error
- FC:Hit into fielder’s choice
- CI:Reached on catcher’s interference
- BB:Base on balls (walks)
- K:Strikeouts
- AVG:Batting average (season)
- OBP:On-base percentage (season)
- SLG:Slugging percentage
- OPS:On-base percentage plus slugging percentage (season)
Batting Stats
| # | Roster | GP | PA | AB | PA/BB | BB/K | C% | SB | CS | SB% | PIK | GIDP | GITP | XBH | TB | AB/HR | BA/RISP | SLG |
|---|---|---|---|---|---|---|---|---|---|---|---|---|---|---|---|---|---|---|
| 12 | Matteo Friggeri | 3 | 8 | 5 | 2.667 | 1.500 | .600 | 2 | 0 | 1.000 | 0 | 0 | 0 | 1 | 3 | — | .667 | .600 |
| 10 | Simone Alfinito Montecchi | 4 | 13 | 11 | 13.000 | .500 | .818 | 0 | 0 | — | 0 | 0 | 0 | 0 | 4 | — | .500 | .364 |
| 13 | Filippo Valenti | 4 | 13 | 12 | 13.000 | .333 | .750 | 0 | 1 | .000 | 0 | 0 | 0 | 1 | 4 | — | .000 | .333 |
| 8 | Davide Azzali | 4 | 13 | 12 | 13.000 | 1.000 | .917 | 1 | 0 | 1.000 | 0 | 1 | 0 | 0 | 3 | — | .250 | .250 |
| 4 | Cesare Astorri | 3 | 10 | 9 | 10.000 | 1.000 | .889 | 0 | 0 | — | 1 | 0 | 0 | 1 | 2 | — | .500 | .222 |
| 9 | Carlo Tanara | 3 | 7 | 6 | 7.000 | .333 | .500 | 1 | 0 | 1.000 | 0 | 0 | 0 | 0 | 1 | — | .000 | .167 |
| 11 | Davide Trolli | 3 | 6 | 6 | — | — | 1.000 | 0 | 0 | — | 0 | 0 | 0 | 0 | 1 | — | .000 | .167 |
| 14 | Marco Corsino | 3 | 7 | 7 | — | .000 | .286 | 0 | 0 | — | 0 | 0 | 0 | 0 | 1 | — | .000 | .143 |
| 7 | Luca Coffrini | 4 | 13 | 9 | 6.500 | .500 | .556 | 0 | 0 | — | 0 | 0 | 0 | 0 | 1 | — | .000 | .111 |
| 24 | Edoardo Acerbi | 4 | 10 | 9 | — | .000 | .778 | 0 | 0 | — | 0 | 0 | 0 | 0 | 1 | — | .250 | .111 |
| 5 | Giulio Cianci | 4 | 11 | 9 | 11.000 | — | 1.000 | 0 | 0 | — | 1 | 0 | 0 | 0 | 1 | — | — | .111 |
| 18 | Michele Pomponi | 2 | 3 | 3 | — | .000 | .333 | 0 | 0 | — | 0 | 0 | 0 | 0 | 0 | — | .000 | .000 |
| 2 | Filippo Tomassoni | 1 | 1 | 1 | — | — | 1.000 | 0 | 0 | — | 0 | 0 | 0 | 0 | 0 | — | — | .000 |
| 1 | Anthony Falanga | 2 | 4 | 3 | 4.000 | 1.000 | .667 | 1 | 0 | 1.000 | 0 | 0 | 0 | 0 | 0 | — | .000 | .000 |
| Totals | 4 | 119 | 102 | 9.917 | .462 | .745 | 5 | 1 | .833 | 2 | 1 | 0 | 3 | 22 | — | .269 | .216 | |
Key
- GP:Games played
- PA:Plate appearances
- AB:At bats
- PA/BB:Plate appearances per walk
- BB/K:Walks per strikeout
- C%:Contact rate
- SB:Stolen bases
- CS:Caught stealing
- SB%:Stolen base percentage
- PIK:Picked off
- GIDP:Hit into double play
- GITP:Hit into triple play
- XBH:Extra-base hits
- TB:Total bases
- AB/HR:At bats per home run
- BA/RISP:Batting average with runners in scoring position
- SLG:Slugging percentage
Batting Stats
| # | Roster | GP | PA | AB | PS | PS/PA | 2S+3 | 2S+3% | 6+ | 6+% | SAC | SF | LOB | 2OUTRBI | HHB | QAB | QAB% |
|---|---|---|---|---|---|---|---|---|---|---|---|---|---|---|---|---|---|
| 12 | Matteo Friggeri | 3 | 8 | 5 | 34 | 4.250 | 2 | .250 | 2 | .250 | 0 | 0 | 3 | 0 | 1 | 5 | 62.50% |
| 1 | Anthony Falanga | 2 | 4 | 3 | 16 | 4.000 | 1 | .250 | 1 | .250 | 0 | 0 | 3 | 0 | 0 | 2 | 50.00% |
| 4 | Cesare Astorri | 3 | 10 | 9 | 43 | 4.300 | 3 | .300 | 4 | .400 | 0 | 0 | 1 | 2 | 2 | 5 | 50.00% |
| 14 | Marco Corsino | 3 | 7 | 7 | 32 | 4.571 | 1 | .143 | 3 | .429 | 0 | 0 | 6 | 0 | 0 | 3 | 42.86% |
| 7 | Luca Coffrini | 4 | 13 | 9 | 48 | 3.692 | 1 | .077 | 0 | .000 | 0 | 1 | 3 | 0 | 1 | 5 | 38.46% |
| 18 | Michele Pomponi | 2 | 3 | 3 | 11 | 3.667 | 1 | .333 | 1 | .333 | 0 | 0 | 2 | 0 | 0 | 1 | 33.33% |
| 8 | Davide Azzali | 4 | 13 | 12 | 49 | 3.769 | 1 | .077 | 2 | .154 | 0 | 0 | 7 | 0 | 2 | 4 | 30.77% |
| 10 | Simone Alfinito Montecchi | 4 | 13 | 11 | 45 | 3.462 | 2 | .154 | 2 | .154 | 0 | 0 | 2 | 1 | 2 | 4 | 30.77% |
| 9 | Carlo Tanara | 3 | 7 | 6 | 30 | 4.286 | 1 | .143 | 1 | .143 | 0 | 0 | 2 | 0 | 0 | 2 | 28.57% |
| 5 | Giulio Cianci | 4 | 11 | 9 | 47 | 4.273 | 2 | .182 | 3 | .273 | 0 | 0 | 3 | 0 | 0 | 3 | 27.27% |
| 13 | Filippo Valenti | 4 | 13 | 12 | 46 | 3.538 | 1 | .077 | 1 | .077 | 0 | 0 | 3 | 0 | 0 | 3 | 23.08% |
| 24 | Edoardo Acerbi | 4 | 10 | 9 | 33 | 3.300 | 0 | .000 | 1 | .100 | 1 | 0 | 6 | 0 | 0 | 2 | 20.00% |
| 11 | Davide Trolli | 3 | 6 | 6 | 16 | 2.667 | 0 | .000 | 0 | .000 | 0 | 0 | 4 | 0 | 1 | 1 | 16.67% |
| 2 | Filippo Tomassoni | 1 | 1 | 1 | 4 | 4.000 | 0 | .000 | 0 | .000 | 0 | 0 | 0 | 0 | 0 | 0 | 0.00% |
| Totals | 4 | 119 | 102 | 454 | 3.815 | 16 | .134 | 22 | .185 | 1 | 1 | 45 | 3 | 9 | 41 | 34.45% | |
Key
- GP:Games played
- PA:Plate appearances
- AB:At bats
- PS:Pitches seen
- PS/PA:Pitches seen per plate appearance
- 2S+3:Plate appearances in which batter sees 3+ pitches after 2 strikes
- 2S+3%:% of plate appearances in which batter sees 3+ pitches after 2 strikes
- 6+:Plate appearances with 6+ pitches
- 6+%:% of plate appearances of 6+ pitches
- SAC:Sacrifice hits & bunts
- SF:Sacrifice flies
- LOB:Runners left on base when batter is out
- 2OUTRBI:2-out RBI
- HHB:Hard hit balls: Total line drives and hard ground balls
- QAB:Quality at bats (any one of: 3 pitches after 2 strikes, 6+ pitch ABs, XBH, HHB, BB, SAC Bunt, SAC Fly)
- QAB%:Quality at bats per plate appearance
Pitching Stats
| # | Roster | IP | GP | GS | W | L | SV | SVO | BS | SV% | H | R | ER | BB | K | HBP | ERA | WHIP |
|---|---|---|---|---|---|---|---|---|---|---|---|---|---|---|---|---|---|---|
| 18 | Michele Pomponi | 12.2 | 2 | 2 | 1 | 0 | 0 | 0 | 0 | — | 7 | 0 | 0 | 0 | 15 | 0 | .000 | .553 |
| 2 | Filippo Tomassoni | 3.0 | 1 | 0 | 0 | 0 | 0 | 0 | 0 | — | 3 | 0 | 0 | 1 | 2 | 0 | .000 | 1.333 |
| 4 | Cesare Astorri | 0.2 | 1 | 1 | 0 | 0 | 0 | 0 | 0 | — | 0 | 3 | 0 | 5 | 1 | 0 | .000 | 7.500 |
| 10 | Simone Alfinito Montecchi | 4.0 | 1 | 1 | 0 | 0 | 0 | 0 | 0 | — | 6 | 3 | 2 | 0 | 1 | 1 | 3.500 | 1.500 |
| 9 | Carlo Tanara | 3.1 | 1 | 0 | 0 | 1 | 0 | 0 | 0 | — | 1 | 3 | 2 | 3 | 1 | 0 | 4.200 | 1.200 |
| 12 | Matteo Friggeri | 4.1 | 2 | 0 | 0 | 1 | 0 | 0 | 0 | — | 10 | 9 | 6 | 4 | 3 | 1 | 9.692 | 3.231 |
| 14 | Marco Corsino | 1.0 | 2 | 0 | 0 | 1 | 0 | 0 | 0 | — | 3 | 4 | 4 | 4 | 0 | 0 | 28.000 | 7.000 |
| 8 | Davide Azzali | 0.2 | 1 | 0 | 0 | 0 | 0 | 0 | 0 | — | 3 | 4 | 3 | 0 | 0 | 1 | 31.500 | 4.500 |
| Totals | 29.2 | 4 | 4 | 1 | 3 | 0 | 0 | 0 | — | 33 | 26 | 16 | 17 | 23 | 3 | 3.775 | 1.685 | |
Key
- IP:Innings Pitched
- GP:Games pitched
- GS:Games started as the pitcher
- W:Wins
- L:Losses
- SV:Saves
- SVO:Save opportunities
- BS:Blown saves
- SV%:Save percentage
- H:Hits allowed
- R:Runs allowed
- ER:Earned runs allowed
- BB:Base on balls (walks)
- K:Strikeouts
- HBP:Hit batters
- ERA:Earned run average (season)
- WHIP:Walks plus hits per innings pitched
Pitching Stats
| # | Roster | IP | BF | #P | TS | TB | P/IP | P/BF | <3 | <3% | LOO | 1ST2OUT | 123INN | <13 |
|---|---|---|---|---|---|---|---|---|---|---|---|---|---|---|
| 9 | Carlo Tanara | 3.1 | 15 | 52 | 28 | 24 | 15.600 | 3.467 | 8 | .533 | 2 | 0 | 0 | 2 |
| 4 | Cesare Astorri | 0.2 | 8 | 38 | 15 | 23 | 57.000 | 4.750 | 2 | .250 | 0 | 0 | 0 | 0 |
| 8 | Davide Azzali | 0.2 | 7 | 20 | 12 | 8 | 30.000 | 2.857 | 5 | .714 | 0 | 0 | 0 | 0 |
| 2 | Filippo Tomassoni | 3.0 | 13 | 51 | 28 | 23 | 17.000 | 3.923 | 5 | .385 | 2 | 1 | 1 | 0 |
| 14 | Marco Corsino | 1.0 | 10 | 39 | 19 | 20 | 39.000 | 3.900 | 4 | .400 | 0 | 0 | 0 | 0 |
| 12 | Matteo Friggeri | 4.1 | 28 | 113 | 69 | 44 | 26.077 | 4.036 | 11 | .393 | 2 | 2 | 1 | 1 |
| 18 | Michele Pomponi | 12.2 | 43 | 152 | 109 | 43 | 12.000 | 3.535 | 22 | .512 | 9 | 8 | 9 | 7 |
| 10 | Simone Alfinito Montecchi | 4.0 | 20 | 61 | 37 | 24 | 15.250 | 3.050 | 12 | .600 | 2 | 0 | 0 | 3 |
| Totals | 29.2 | 144 | 526 | 317 | 209 | 17.730 | 3.653 | 69 | .479 | 17 | 11 | 11 | 13 | |
Key
- IP:Innings Pitched
- BF:Total batters faced
- #P:Total pitches
- TS:Total strikes
- TB:Total balls
- P/IP:Pitches per inning
- P/BF:Pitches per batter faced
- <3:Batters on or out in three pitches or less
- <3%:% of batters on or out in three pitches or less
- LOO:Leadoff out (1st batter of inning)
- 1ST2OUT:Innings with 1st 2 batters out
- 123INN:1-2-3 Innings
- <13:Innings of 13 pitches or fewer
Pitching Stats
| # | Roster | IP | BF | TS | S% | FPS | FPS% | FPSO% | FPSW% | FPSH% | BB/INN | 0BBINN | BBS | LOBB | LOBBS | WP |
|---|---|---|---|---|---|---|---|---|---|---|---|---|---|---|---|---|
| 9 | Carlo Tanara | 3.1 | 15 | 28 | .538 | 11 | .733 | .818 | .000 | .000 | .900 | 2 | 3 | 2 | 2 | 0 |
| 4 | Cesare Astorri | 0.2 | 8 | 15 | .395 | 3 | .375 | .667 | .333 | .000 | 7.500 | 0 | 2 | 1 | 1 | 0 |
| 8 | Davide Azzali | 0.2 | 7 | 12 | .600 | 2 | .286 | .500 | .000 | .000 | .000 | 0 | 0 | 0 | 0 | 0 |
| 2 | Filippo Tomassoni | 3.0 | 13 | 28 | .549 | 6 | .462 | .667 | .000 | .333 | .333 | 2 | 0 | 0 | 0 | 1 |
| 14 | Marco Corsino | 1.0 | 10 | 19 | .487 | 5 | .500 | .400 | .200 | .200 | 4.000 | 0 | 2 | 1 | 1 | 0 |
| 12 | Matteo Friggeri | 4.1 | 28 | 69 | .611 | 12 | .429 | .667 | .083 | .167 | .923 | 2 | 1 | 1 | 0 | 0 |
| 18 | Michele Pomponi | 12.2 | 43 | 109 | .717 | 31 | .721 | .774 | .000 | .161 | .000 | 12 | 0 | 0 | 0 | 0 |
| 10 | Simone Alfinito Montecchi | 4.0 | 20 | 37 | .607 | 10 | .500 | .800 | .000 | .200 | .000 | 4 | 0 | 0 | 0 | 0 |
| Totals | 29.2 | 144 | 317 | .603 | 80 | .556 | .725 | .037 | .150 | .573 | 22 | 8 | 5 | 4 | 1 | |
Key
- IP:Innings Pitched
- BF:Total batters faced
- TS:Total strikes
- S%:Strike percentage
- FPS:First pitch strikes
- FPS%:First pitch strike percentage
- FPSO%:% of FPS at-bats that result in an out
- FPSW%:% of FPS at-bats that result in a walk
- FPSH%:% of FPS at-bats that result in a hit
- BB/INN:Walks per inning
- 0BBINN:Zero-walk innings
- BBS:Walks that score
- LOBB:Leadoff walk (1st batter of inning)
- LOBBS:Leadoff walk that scored (1st batter of inning)
- WP:Wild pitches
Pitching Stats
| # | Roster | IP | BF | ABA | #P | SM | SM% | K | K/G | K/BF | K/BB | WEAK% | HHB% | GB% | FLY% | GO | AO | GO/AO | BAA | HR |
|---|---|---|---|---|---|---|---|---|---|---|---|---|---|---|---|---|---|---|---|---|
| 9 | Carlo Tanara | 3.1 | 15 | 11 | 52 | 1 | .019 | 1 | 2.100 | .067 | .333 | .909 | .091 | .667 | .333 | 5 | 3 | 1.667 | .091 | 0 |
| 4 | Cesare Astorri | 0.2 | 8 | 3 | 38 | 2 | .053 | 1 | 10.500 | .125 | .200 | 1.000 | .000 | 1.000 | .000 | 1 | 0 | — | .000 | 0 |
| 8 | Davide Azzali | 0.2 | 7 | 5 | 20 | 1 | .050 | 0 | .000 | .000 | — | .500 | .500 | .500 | .500 | 1 | 1 | 1.000 | .600 | 0 |
| 2 | Filippo Tomassoni | 3.0 | 13 | 12 | 51 | 4 | .078 | 2 | 4.667 | .154 | 2.000 | .600 | .400 | .375 | .625 | 1 | 5 | .200 | .250 | 0 |
| 14 | Marco Corsino | 1.0 | 10 | 5 | 39 | 0 | .000 | 0 | .000 | .000 | .000 | .667 | .333 | .500 | .500 | 2 | 1 | 2.000 | .600 | 0 |
| 12 | Matteo Friggeri | 4.1 | 28 | 23 | 113 | 3 | .027 | 3 | 4.846 | .107 | .750 | .700 | .300 | .294 | .706 | 4 | 6 | .667 | .435 | 0 |
| 18 | Michele Pomponi | 12.2 | 43 | 41 | 152 | 19 | .125 | 15 | 8.289 | .349 | — | .857 | .143 | .478 | .522 | 13 | 8 | 1.625 | .171 | 0 |
| 10 | Simone Alfinito Montecchi | 4.0 | 20 | 19 | 61 | 0 | .000 | 1 | 1.750 | .050 | — | .833 | .167 | .600 | .400 | 6 | 4 | 1.500 | .316 | 0 |
| Totals | 29.2 | 144 | 119 | 526 | 30 | .057 | 23 | 5.427 | .160 | 1.353 | .772 | .228 | .488 | .512 | 33 | 28 | 1.179 | .277 | 0 | |
Key
- IP:Innings Pitched
- BF:Total batters faced
- ABA:At Bats against
- #P:Total pitches
- SM:Opposing batter swings-and-misses
- SM%:% of total pitches that are swings and misses
- K:Strikeouts
- K/G:Strikeouts per regulation game
- K/BF:Strikeouts per batter faced
- K/BB:Strikeouts per walk
- WEAK%:% of batted balls weakly hit (fly balls and ground balls)
- HHB%:% of batted balls that are line drives or hard ground balls
- GB%:% of all batted balls hit on the ground
- FLY%:% of batted balls that are hit in the air
- GO:Ground outs
- AO:‘Air’ outs (fly outs)
- GO/AO:Ratio of ground outs to fly outs
- BAA:Opponent batting average
- HR:Home runs allowed
Pitching Stats
| # | Roster | IP | LOB | BK | PIK | SB | CS | SB% |
|---|---|---|---|---|---|---|---|---|
| 9 | Carlo Tanara | 3.1 | 5 | 0 | 0 | 2 | 1 | .667 |
| 4 | Cesare Astorri | 0.2 | 0 | 0 | 0 | 1 | 0 | 1.000 |
| 8 | Davide Azzali | 0.2 | 1 | 0 | 0 | 0 | 0 | — |
| 2 | Filippo Tomassoni | 3.0 | 4 | 0 | 0 | 0 | 0 | — |
| 14 | Marco Corsino | 1.0 | 3 | 0 | 0 | 0 | 0 | — |
| 12 | Matteo Friggeri | 4.1 | 5 | 0 | 0 | 4 | 0 | 1.000 |
| 18 | Michele Pomponi | 12.2 | 4 | 0 | 0 | 0 | 1 | .000 |
| 10 | Simone Alfinito Montecchi | 4.0 | 6 | 0 | 0 | 0 | 0 | — |
| Totals | 29.2 | 28 | 0 | 0 | 7 | 2 | .778 | |
Key
- IP:Innings Pitched
- LOB:Runners left on base
- BK:Balks
- PIK:Runners picked off
- SB:Stolen bases allowed
- CS:Runners caught stealing
- SB%:Opponent stolen base percentage
Fielding Stats
| # | Roster | TC | A | PO | E | DP | TP | FPCT |
|---|---|---|---|---|---|---|---|---|
| 1 | Anthony Falanga | 2 | 0 | 1 | 1 | 0 | 0 | .500 |
| 9 | Carlo Tanara | 8 | 1 | 7 | 0 | 0 | 0 | 1.000 |
| 4 | Cesare Astorri | 23 | 3 | 19 | 1 | 0 | 0 | .957 |
| 8 | Davide Azzali | 4 | 0 | 3 | 1 | 0 | 0 | .750 |
| 11 | Davide Trolli | 4 | 0 | 4 | 0 | 0 | 0 | 1.000 |
| 24 | Edoardo Acerbi | 30 | 0 | 30 | 0 | 2 | 0 | 1.000 |
| 2 | Filippo Tomassoni | 0 | 0 | 0 | 0 | 0 | 0 | — |
| 13 | Filippo Valenti | 20 | 13 | 5 | 2 | 2 | 0 | .900 |
| 5 | Giulio Cianci | 9 | 5 | 4 | 0 | 0 | 0 | 1.000 |
| 7 | Luca Coffrini | 7 | 1 | 4 | 2 | 0 | 0 | .714 |
| 14 | Marco Corsino | 4 | 1 | 3 | 0 | 0 | 0 | 1.000 |
| 12 | Matteo Friggeri | 8 | 3 | 1 | 4 | 1 | 0 | .500 |
| 18 | Michele Pomponi | 9 | 3 | 6 | 0 | 0 | 0 | 1.000 |
| 10 | Simone Alfinito Montecchi | 8 | 6 | 2 | 0 | 0 | 0 | 1.000 |
| Totals | 136 | 36 | 89 | 11 | 2 | 0 | .919 | |
Key
- TC:Total Chances
- A:Assists
- PO:Putouts
- E:Errors
- DP:Double Plays
- TP:Triple Plays
- FPCT:Fielding Percentage
Immagini correlate:


